Analytics Engineer Career Roadmap
Analytics engineers turn raw warehouse tables into the clean, tested models that analysts and business teams use every day. They write SQL transformations, document what each metric means, and version the whole thing like software. The role sits between data engineering, which moves data, and analysis, which asks questions of it. The test of the work is simple: two teams should get the same answer to the same question.
Is this the right path for you?
You are an analyst who keeps rewriting the same SQL, or a data engineer who likes the business side more than the pipeline side. Analytics engineering is where those paths meet: you model the data once, so analysts stop re-deriving it.
The mindset signal is caring whether a number is right six months later, not only on the day you wrote the query. If you like naming things precisely, writing tests for data, and arguing about what "active customer" means, you will enjoy this work.
Entry is competitive because many analysts already write the SQL. The differentiator is software practice: version control, tests, documentation and deployment. A portfolio with one tested, documented dbt project shows that more clearly than another dashboard.
Career Progression
Where does this role lead?
Click any role to explore timeline, key skills and, where the Department of Labor publishes it, pay.
Entry
Junior Analytics Engineer
~0–2 yrs
$62,546 (Level I)
You build and test models that a senior engineer reviews, and you learn why each grain and join was chosen.
Key skills
Pay shown is the U.S. Department of Labor prevailing wage for Level I (entry), Level III (mid) and Level IV (senior) in the nearest BLS occupation, base wage for the typical metro, wage year 2025, shown for the main track only. It is a benchmark, not an offer; branches and lead, staff and executive stages have no official figure.
Visual roadmap
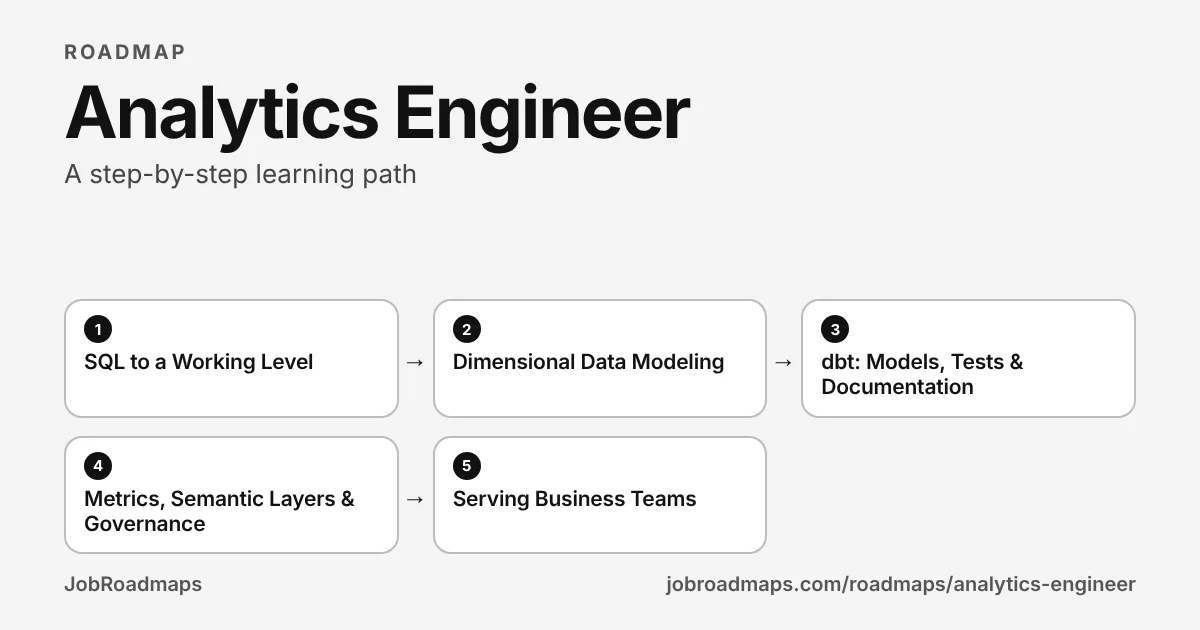
Analytics Engineer learning path
Work down the line, one step at a time. Tick each skill as you can do it.
- 1
SQL to a Working Level
6–8 weeksAnalytics engineering is mostly SQL, and the difference between a working query and a correct one is joins, grain and null handling. Learn joins, aggregation, window functions and CTEs well, and read query plans so you can tell when a model is slow and why.
Skills to learn
- Joins & aggregation
- Window functions
- CTEs & subqueries
- Null and duplicate handling
- Reading query plans
Start with
- 2
Dimensional Data Modeling
4–6 weeksModels are built around a grain: one row per order, per customer per day, per session. Learn fact and dimension tables, star schemas, and how to handle a dimension that changes over time. Most broken dashboards trace back to a grain nobody wrote down.
Skills to learn
- Grain definition
- Fact and dimension tables
- Star schemas
- Slowly changing dimensions
- Naming conventions
Start with
- 3
dbt: Models, Tests & Documentation
6–8 weeksdbt is the standard tool for this layer: SQL models that reference each other, tests that run on every build, and documentation generated from the code. Learn sources, refs, incremental models and tests, and keep the project in Git so that every change is reviewed.
Skills to learn
- dbt Core
- Sources & refs
- Schema and data tests
- Incremental models
- Generated documentation
- Git workflow
Start with
- 4
Metrics, Semantic Layers & Governance
4–6 weeksA metric is only useful if everyone computes it the same way. Put definitions in code, expose them through a semantic layer, and track lineage so you can answer 'what feeds this dashboard?' Add data contracts so an upstream change does not silently break a report.
Skills to learn
- Metric definitions as code
- Semantic layers
- Column-level lineage
- Data contracts
- Access control in the warehouse
Start with
- 5
Serving Business Teams
4–6 weeksYour models are only valuable when someone uses them. Learn one or two BI tools well enough to build a trustworthy dashboard, set up a request process, deprecate old models without breaking reports, and keep warehouse costs in view.
Skills to learn
- BI tools (Looker, Metabase, Tableau or Power BI)
- Stakeholder requests & prioritization
- Model deprecation
- Warehouse cost awareness
- Documentation for non-technical readers
Start with
jobroadmaps.com/roadmaps/analytics-engineer · Pay, demand and employer data for this role are further down the page.
Books worth reading as a Analytics Engineer
Where to start, in order. The full list of 9, grouped by career stage, is on its own page.
Getting started

Learning SQL
by Alan Beaulieu · 2005
~380 pages~10 hrs to read
Joins, aggregation, subqueries and set logic taught in order, with exercises. It is the fastest route to the SQL fluency that analytics engineering depends on.
View book →
The Data Warehouse Toolkit: The Definitive Guide to Dimensional Modeling
by Ralph Kimball, Margy Ross · 1996
~600 pages~15 hrs to read
The standard reference on facts, dimensions, grain and slowly changing dimensions. Read it before you model your first warehouse table, and keep it open when a grain question stalls the work.
View book →
Doing the job
The Kimball Group Reader: Relentlessly Practical Tools for Data Warehousing and Business Intelligence
by Ralph Kimball, Margy Ross, Warren Thornthwaite, Joy Mundy, Bob Becker · 2010
~740 pages~19 hrs to read
Collected articles from the Kimball Group on modeling problems that come up in real projects. Each article is short and answers one practical question.
View book →
Storytelling with Data: A Data Visualization Guide for Business Professionals
by Cole Nussbaumer Knaflic · 2015
~290 pages~7 hrs to read
How to choose the chart and the message for a business audience. Analytics engineers whose models feed dashboards benefit from knowing what those dashboards must show.
View book →
Senior and leading

Data Quality Fundamentals: A Practitioner's Guide to Building Trustworthy Data Pipelines
by Barr Moses, Lior Gavish, Molly Vorwerck · 2022
How to define, measure and monitor data quality, and how to decide which failures stop a release. Read it when you are deciding which tests belong in the project and who owns them.
View book →
Designing Data-Intensive Applications
by Martin Kleppmann · 2017
~620 pages~16 hrs to read
The trade-offs behind storage, replication, partitioning and consistency. Read it to understand the systems your models run on well enough to explain their limits to the business.
View book →
All 9 books for a Analytics Engineer →Browse all books →
Some book links are affiliate links: we earn a small commission if you buy, at no cost to you. It does not affect what we list.
Courses and certifications for a Analytics Engineer
5 courses, tutorials and certifications, each read on the provider's own page. One from each stage to start; the full list, with a guide to choosing, is on its own page.
Getting started · Course
dbt Fundamentals
dbt Labs
Doing the job · Hands-on tutorial
Learn Metabase
Metabase
Senior and leading · Hands-on tutorial
What is the dbt Semantic Layer?
dbt Labs
Prerequisites & Education
What credentials do employers look for?
These are the most common paths into this role — no single one is required.
Education Level
View list — coming soon- Bachelor's in Statistics, Mathematics, Economics or Computer Science
- Bachelor's in any quantitative discipline with SQL experience
Analytics engineering hires come from analysis, economics and engineering backgrounds. Careful SQL and clear writing matter more than the degree title.
Certifications
View list — coming soon- No certificate is standard for analytics engineering. Hiring teams look for a working dbt project.
A certificate helps only if your target employer uses that warehouse or BI stack.
Bootcamps & Training
View list — coming soon- dbt Fundamentals — free course from dbt Labs
- SQLBolt — free interactive SQL lessons
- PostgreSQL tutorial — free official documentation
Start with the free courses, then build a project that uses what you learned.
Portfolio & Other
View list — coming soon- A public dbt project on a dataset with tests, documentation and a README per model
- A metric definitions file that two dashboards share
- A short note describing a data bug you found and how a test now catches it
Show the tests and documentation. Analysts and hiring managers look for evidence that the numbers are checked.
Your Roadmap
5 stepsSQL to a Working Level
6–8 weeksAnalytics engineering is mostly SQL, and the difference between a working query and a correct one is joins, grain and null handling. Learn joins, aggregation, window functions and CTEs well, and read query plans so you can tell when a model is slow and why.
Skills to learn
Dimensional Data Modeling
4–6 weeksModels are built around a grain: one row per order, per customer per day, per session. Learn fact and dimension tables, star schemas, and how to handle a dimension that changes over time. Most broken dashboards trace back to a grain nobody wrote down.
Skills to learn
dbt: Models, Tests & Documentation
6–8 weeksdbt is the standard tool for this layer: SQL models that reference each other, tests that run on every build, and documentation generated from the code. Learn sources, refs, incremental models and tests, and keep the project in Git so that every change is reviewed.
Skills to learn
Metrics, Semantic Layers & Governance
4–6 weeksA metric is only useful if everyone computes it the same way. Put definitions in code, expose them through a semantic layer, and track lineage so you can answer 'what feeds this dashboard?' Add data contracts so an upstream change does not silently break a report.
Skills to learn
Serving Business Teams
4–6 weeksYour models are only valuable when someone uses them. Learn one or two BI tools well enough to build a trustworthy dashboard, set up a request process, deprecate old models without breaking reports, and keep warehouse costs in view.
Skills to learn
Start here this week
This week, take one report or dashboard you already use and trace one number back to its source tables. Write down every join and filter in between. You have just found the model that analytics engineering would make explicit and test.
Then complete the free dbt Fundamentals course and rebuild that path in a small dbt project on a public dataset, with tests on the key columns and a documented definition for each metric. Publish it. That project is your entry proof.
Pay
U.S. Department of Labor data for the nearest BLS occupation, Data scientists. BLS has no occupation for this exact title, so treat these as a benchmark.
Median: U.S. Bureau of Labor Statistics, Occupational Employment and Wage Statistics (median wage, May 2024) and Employment Projections (2024–34). Levels: U.S. Department of Labor Office of Foreign Labor Certification prevailing wage levels (wage year 2025, typical metro), a base-wage benchmark for the metro in the middle of 339 areas, not an offer. See every metro.
Job Titles at Each Level
Entry
Junior Analytics Engineer / Data Analyst with dbt
Mid
Analytics Engineer
Senior
Senior Analytics Engineer / Analytics Engineering Lead
Steps Overview
- 1
SQL to a Working Level
6–8 weeks
- 2
Dimensional Data Modeling
4–6 weeks
- 3
dbt: Models, Tests & Documentation
6–8 weeks
- 4
Metrics, Semantic Layers & Governance
4–6 weeks
- 5
Serving Business Teams
4–6 weeks
Explore more roadmaps
Not sure this is the right path? Browse all tech career roadmaps.
View Similar RoadmapsBuilt a project while following this roadmap?
Turn it into a hiring-ready case study in 10 seconds — free.
Ready to explore more?
Browse all career roadmaps across tech, business, and creative fields.