Best books for Data Analysts
From querying to communicating to deciding. The first set builds SQL, statistical intuition, a habit of presenting data clearly and a sceptical eye for misleading charts. The build set adds Python for data work, SQL patterns, dashboard design and visualisation principles. The lead set covers experimentation, thinking about data for business problems and making data literate across a team.
The first months in the role
Your first months will involve a lot of 'can you check this number?' The good news is that checking is a skill, and it is the one that earns trust fastest. Before you report a figure, know where it came from, how it was filtered and whether it agrees with what the team already believes. When it does not agree, that is usually the most interesting part of the analysis.
Start with SQL and the basics of charts, then add enough statistics to tell a real change from ordinary noise. Keep a note of every question you answer and how you answered it. You will be surprised how often the same question returns, and that note becomes the template for the reports people ask you to repeat.
Questions you may be asked
- How do you decide whether a change in a metric is real, or just the usual wobble?
- Tell me about a report you built that changed someone's decision.
- Two dashboards show different totals for the same month. What do you check first?
Common mistakes, and what to read
Building a dashboard before anyone has said which decision it should support. Ask the question first; the chart will be easier to design.
See The Big Book of Dashboards on this list.
Trusting a chart without checking how it was built. A change of axis or time window can turn an ordinary month into a crisis.
See How Charts Lie on this list.
11 books in 3 stages, about 4,010 pages (100 hours of reading). The notes are ours, with no ratings or sales claims.
See the full Data Analyst roadmap →Best courses for Data Analysts →
How to choose your books
A short method, so you read the right book for where you are instead of the longest list.
Find your stage
Getting started · 4 books
Query, count and show: SQL, statistics without the maths overhead, clear presentation and chart honesty.
Jump to this stage ↓Doing the job · 4 books
Analysis at working speed: Python data tools, SQL recipes, dashboard design and visualisation craft.
Jump to this stage ↓Senior and leading · 3 books
Decision support: running experiments, framing business problems and raising data literacy around you.
Jump to this stage ↓
If you are unsure, start one stage lower than you think. Books in a later stage assume the working knowledge the earlier ones give you.
Begin with one book
Our starting pick
Practical SQL: A Beginner's Guide to Storytelling with Data, 2nd Edition
by Anthony DeBarros · 2018
SQL is the working language of most analyst jobs. This book teaches it through real datasets you can query right away.
See the book ↓Then pick by your situation
Choose the next book by the problem in front of you, not by its place in the list.
If you can run analyses but your charts confuse people
read Storytelling with Data (getting started)
If you are building dashboards for others to use
read The Big Book of Dashboards (doing the job)
If you need to understand data and statistics without the heavy maths
read Naked Statistics (getting started)
Check it against what Data Analyst postings ask for
These skills come from our analysis of live Data Analyst job postings. If one is new to you, its book list sits one click away.
Each step on the scale reflects how often live job postings name the skill, tool or credential, based on our analysis of those postings. With fewer than 100 postings behind this page, treat the scale as directional: a sample this size can shift a skill by a step or more.
Set a time budget
| Stage | Books | Pages | Reading | At 3 hrs a week |
|---|---|---|---|---|
| Getting started | 4 | 1,240 | 31 hrs | 10 wks |
| Doing the job | 4 | 1,890 | 47 hrs | 16 wks |
| Senior and leading | 3 | 880 | 22 hrs | 7 wks |
| All 3 stages | 11 | 4,010 | 100 hrs | 33 wks |
Treat this as a ceiling, not a target. Read one book at a time, apply it, then move on; read reference-style books in sections.
Judge any book before you buy it
Age
This list runs from 2005 (SQL Cookbook) to 2021 (Becoming a Data Head). Older books earn their place by teaching principles that do not change. For tools and platforms, buy the latest edition.
Level
Check the stage before the title. A book from a later stage will make sense only once you have faced the problems it solves.
Format
The longest book here, Python for Data Analysis, 3rd Edition, runs about 550 pages. Read very long books as references: pick the chapter that matches the problem you have.
Fit
Ask what you will do differently the week after you finish. If you cannot answer, the book is for a different moment. Come back to it when the situation arrives.
Getting started
Query, count and show: SQL, statistics without the maths overhead, clear presentation and chart honesty.
 Start here
Practical SQL: A Beginner's Guide to Storytelling with Data, 2nd Edition
by Anthony DeBarros · 2018
~390 pages~10 hrs to read
Teaches SQL through real public datasets, covering joins, aggregation, statistics functions and data cleaning in PostgreSQL. A good first book for analysts who learn best by working on real data.
View book →
Naked Statistics: Stripping the Dread from the Data
by Charles Wheelan · 2013
~300 pages~8 hrs to read
A plain-language tour of averages, correlation, sampling, regression and inference using everyday examples. Read it early to build the statistical judgement that keeps analyses honest.
View book →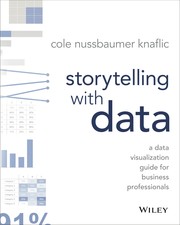
Storytelling with Data: A Data Visualization Guide for Business Professionals
by Cole Nussbaumer Knaflic · 2015
~290 pages~7 hrs to read
Teaches how to choose the right chart, remove clutter and build a narrative around a result. Read it before your next stakeholder readout, since an unclear chart is the usual reason a good analysis gets ignored.
View book →
How Charts Lie: Getting Smarter about Visual Information
by Alberto Cairo · 2019
~260 pages~7 hrs to read
Shows how charts mislead through scales, selection and framing, and how to read and design them more carefully. Read it when you start making charts others will rely on.
View book →
Doing the job
Analysis at working speed: Python data tools, SQL recipes, dashboard design and visualisation craft.

Python for Data Analysis, 3rd Edition
by Wes McKinney · 2011
~550 pages~14 hrs to read
Written by the creator of pandas, it covers loading, cleaning, reshaping and summarising tabular data in Python. Read it early, alongside real datasets, because nearly every later data task starts with these skills.
View book →SQL Cookbook: Query Solutions and Techniques for All SQL Users, 2nd Edition
by Anthony Molinaro, Robert de Graaf · 2005
~500 pages~13 hrs to read
Task-based recipes for window functions, pivoting, hierarchical queries, date handling and other problems that come up in real analysis. Keep it open once you are writing SQL daily.
View book →
The Big Book of Dashboards: Visualizing Your Data Using Real-World Business Scenarios
by Steve Wexler, Jeffrey Shaffer, Andy Cotgreave · 2017
~450 pages~11 hrs to read
Dozens of real dashboards organised by business scenario, with notes on what works and what to avoid. Read it before you design reporting for sales, operations or finance teams.
View book →
Fundamentals of Data Visualization: A Primer on Making Informative and Compelling Figures
by Claus O. Wilke · 2019
~390 pages~10 hrs to read
Explains how to pick chart types, use colour and handle uncertainty, with many worked examples. A principled reference for analysts who want their charts to hold up to scrutiny.
View book →
Senior and leading
Decision support: running experiments, framing business problems and raising data literacy around you.
Trustworthy Online Controlled Experiments: A Practical Guide to A/B Testing
by Ron Kohavi, Diane Tang, Ya Xu · 2020
~200 pages~5 hrs to read
The reference on running A/B tests that you can believe: metric choice, pitfalls, sample ratio checks and experiment platforms. Read it when you own experimentation or advise a team on it.
View book →
Data Science for Business: What You Need to Know about Data Mining and Data-Analytic Thinking
by Foster Provost, Tom Fawcett · 2013
~410 pages~10 hrs to read
Frames data science as a way to make business decisions, covering problem framing, evaluation and the trade-offs behind predictive models. A good fit for senior data scientists who must scope projects and explain their value to non-technical leaders.
View book →
Becoming a Data Head: How to Think, Speak, and Understand Data Science, Statistics, and Machine Learning
by Alex J. Gutman, Jordan Goldmeier · 2021
~270 pages~7 hrs to read
Aimed at business readers, it explains how to question data claims, statistics and models. Useful for analysts who advise leaders and want to practise explaining and challenging results.
View book →
Book links go to Amazon and are affiliate links. As an Amazon Associate I earn from qualifying purchases.
Frequently asked questions
Which book should a Data Analyst read first?
Practical SQL: A Beginner's Guide to Storytelling with Data, 2nd Edition by Anthony DeBarros. SQL is the working language of most analyst jobs. This book teaches it through real datasets you can query right away.
Do I need to read all 11 books?
No. The list is a menu, not a syllabus. Find your stage (getting started: 4, doing the job: 4, senior and leading: 3), begin with one book (we suggest Practical SQL: A Beginner's Guide to Storytelling with Data, 2nd Edition), then pick the next book by the problem you are facing at work. Come back to the others when the situation they cover arrives.
How long does it take to read these books?
All 11 books add up to about 4,010 pages, roughly 100 hours at 1.5 minutes a page. At three hours a week that is about 33 weeks; at six hours a week, about 17. The list is meant to be read over time, one book at a time, not in one run.
Are these books up to date?
They range from 2005 (SQL Cookbook) to 2021 (Becoming a Data Head). Older titles are included because they teach principles that have not changed; for tools and platforms, we favour recent editions. Check the edition before you buy.
Related reading
Some links are affiliate links: we earn a small commission if you buy, at no cost to you. It does not change what we list.